What A Regime Is Here
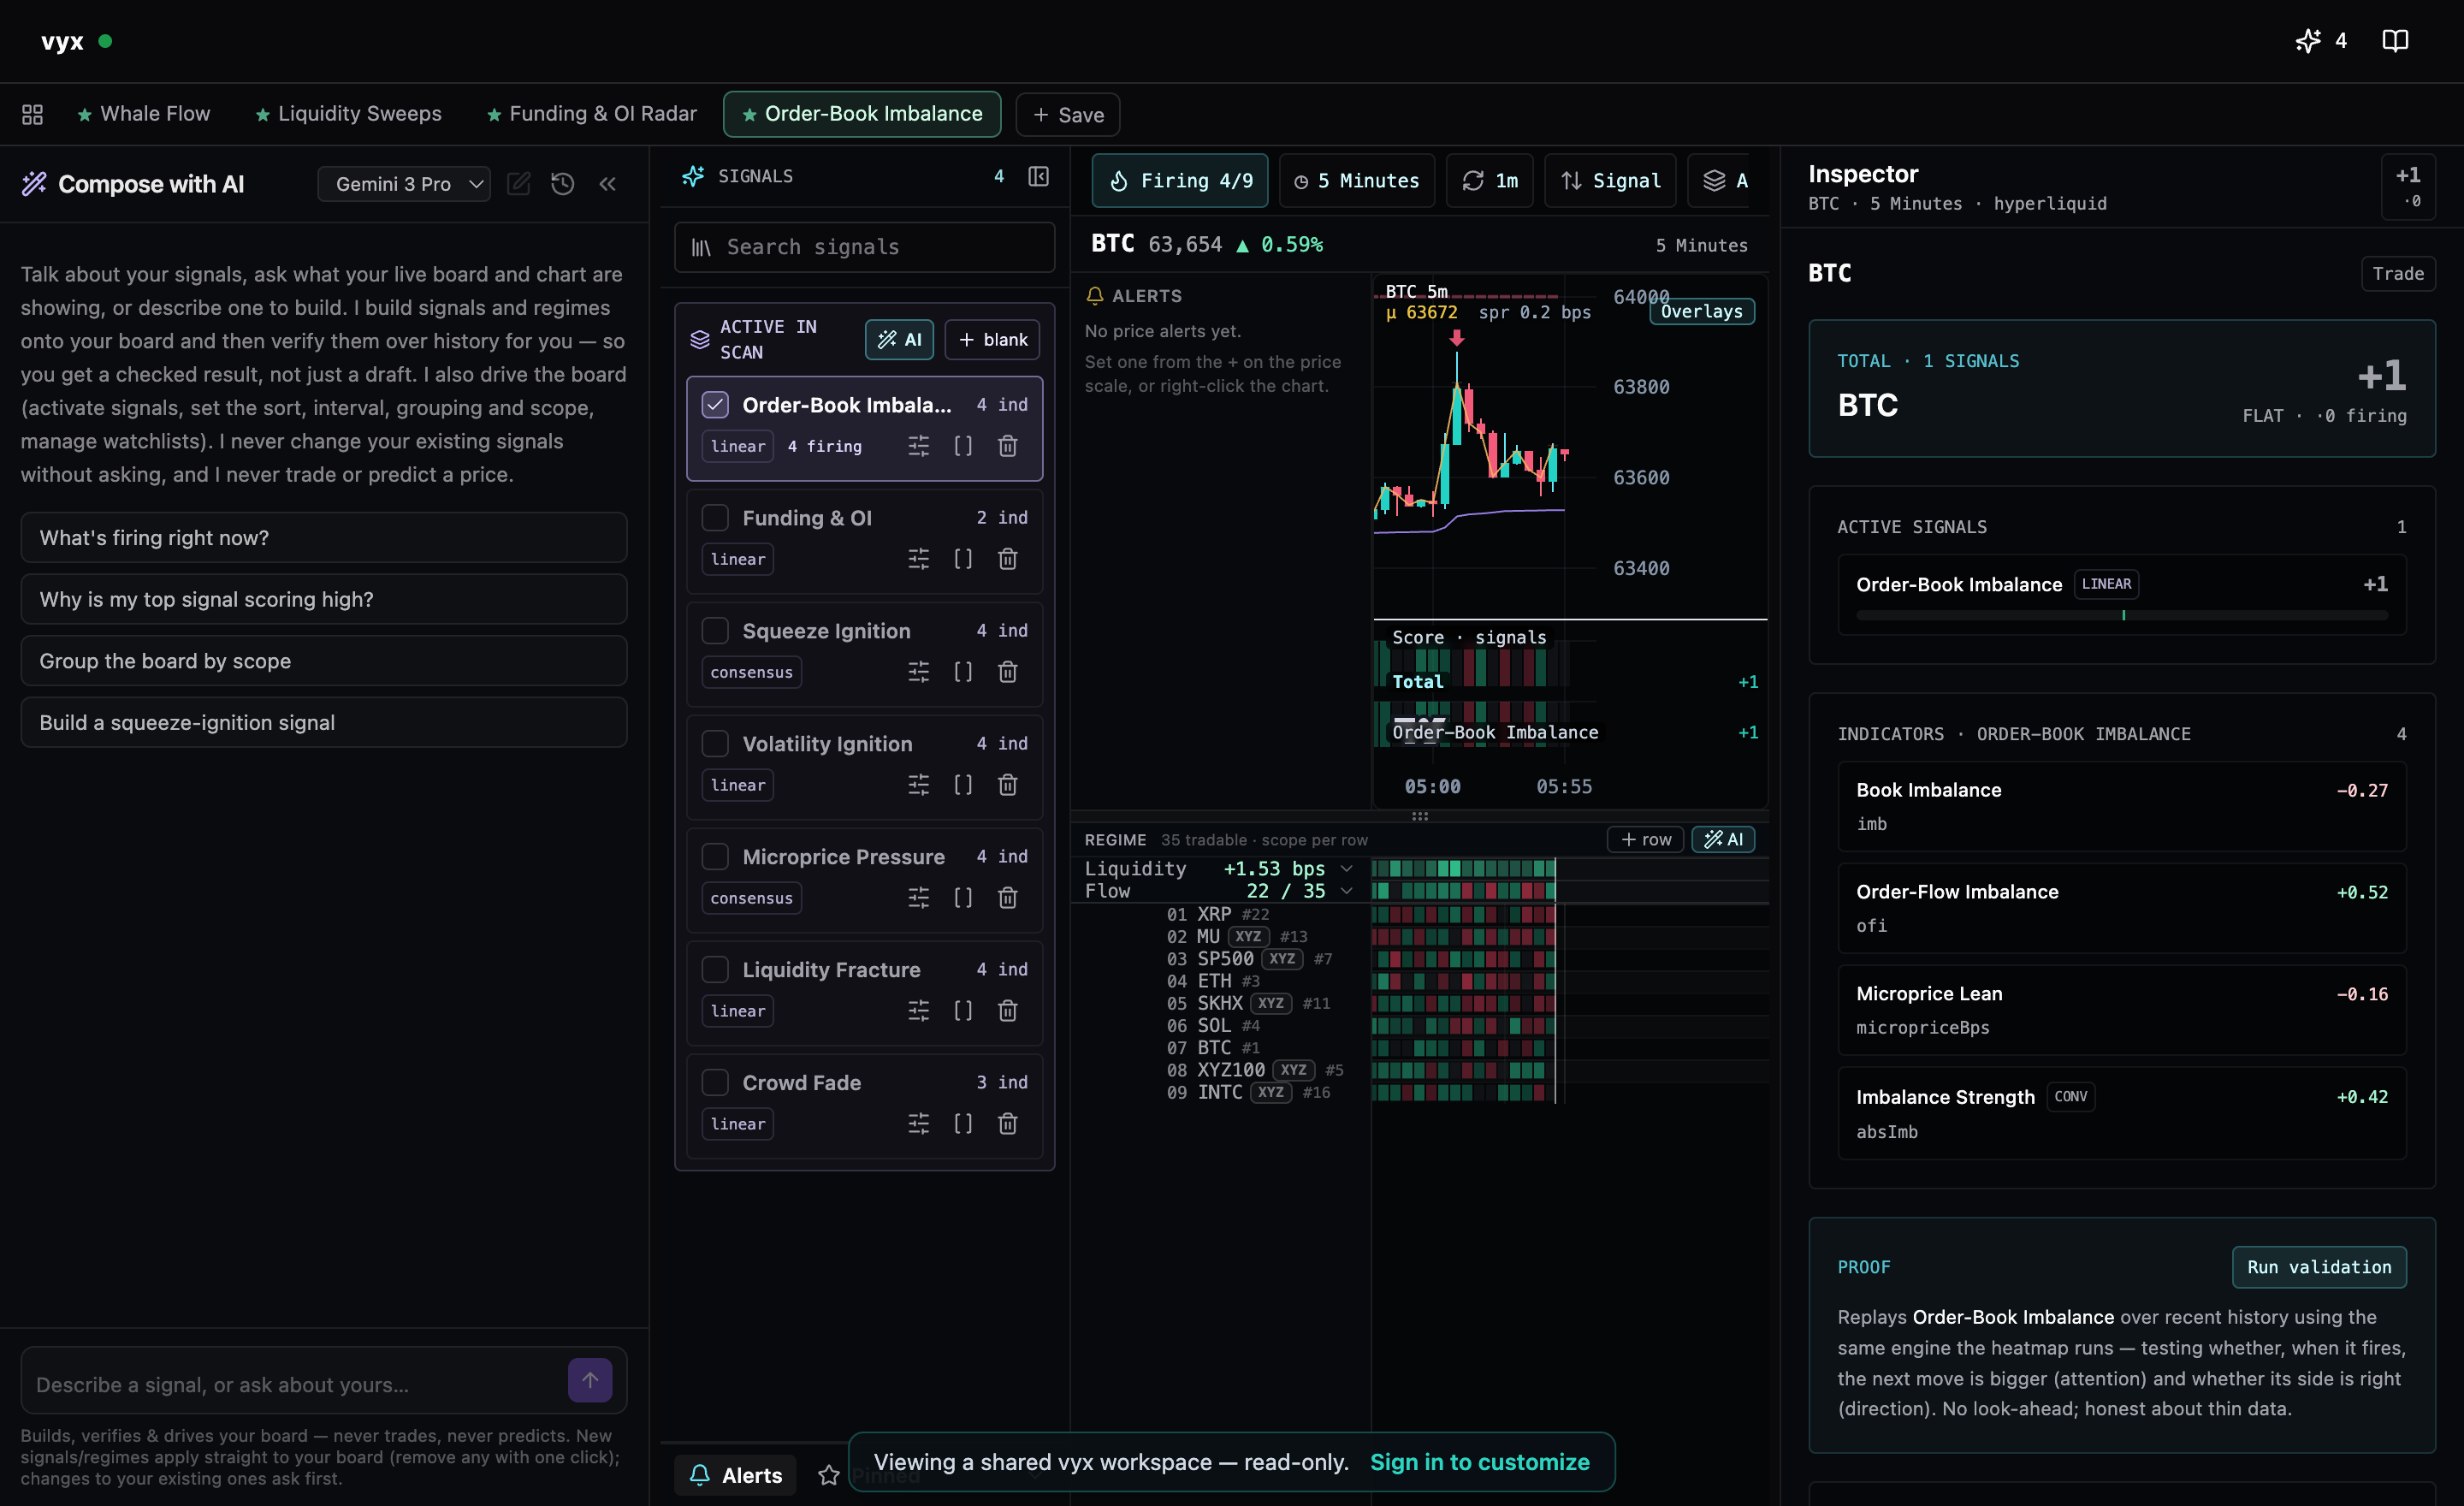
Most tools hand you a regime as a word — risk-on, risk-off, trending, choppy — computed somewhere you cannot see. In VYX a regime is a measured number per candle: take one metric every market already carries (funding, open interest change, spread, order-flow imbalance, CVD, or a formula of your own), reduce it across a slice of the venue (the median, the mean, or the share of markets meeting a condition), and paint the result on the same timeline as the board. That is the whole definition. It is context, not a trigger — a description of the market’s state that you can read against its own recent range.
Compose It, Do Not Inherit It
Nothing in the band is baked in. Click a row’s name to set what it measures, how it reduces, and which slice of the market it reads. Or describe the row in a sentence and let the AI build it. Order the rows the way you read them; the order follows your account to every device.
- Median funding across all markets — is leverage paying to be long or short, venue-wide?
- Share of crypto where OFI is firing — is order-flow pressure broad or isolated to a few names?
- Median spread across tokenized equities — are the equity books tight enough to trade, or has liquidity stepped back?
- Breadth of open-interest surges among memes — is new money entering the most speculative corner?
One Timeline For State And Setup
The reason regimes live above the board rather than on a separate page is the clock. A setup is a moment on a market’s timeline; a regime is the venue’s state at that same moment. When both are drawn on one axis you stop asking only whether the setup is clean and start asking whether the market agrees with it. An A+ setup is the one where flow, positioning and regime agree — and the band is what shows the third part.
Cohorts: Two Rows, One Venue
Scope one row to memes and another to L1s, or one to crypto and another to tokenized equities, and the band becomes a comparison: which cohort is leading, which is being sold into, and where the two diverge. Hyperliquid lists crypto, tokenized equities, commodities, FX and indices as perpetuals with funding and open interest, so the cross-asset read is measured from the same kind of data, not stitched from different feeds.
Read By Your Analyst And Your AI
The desk analyst reads every regime row as a series — the last 100 bars, oldest to newest — before it decides whether a setup on your desk is worth a card. Over the MCP connector your own AI gets the same read: ask ChatGPT or Claude for the regime series and it reasons from “median funding +3 bps and rising for forty bars” rather than from a headline.
Related
FAQ
What is a market regime in VYX?
One metric reduced across a slice of the venue into a single number per candle — for example the median funding rate across all 300+ markets, or the share of crypto markets where order-flow imbalance is firing — painted on the same timeline as the board. You choose the metric, the reduction, and the slice.
Is a regime a prediction or a trade signal?
No. A regime row describes the market’s current state from measured data. It is context for judging a setup, never a trigger to buy or sell, and VYX gives no advice.
Which markets can a regime read?
Any slice of Hyperliquid’s 300+ perpetuals: everything, a set of asset classes (crypto, tokenized equities, commodities, FX, indices), one sector or theme, one of your watchlists, what is currently on screen, or only the markets where your signals are firing.
Can my AI read the regime?
Yes. Over the VYX MCP connector, ChatGPT, Claude or any MCP client can ask for your regime rows as a series over the last 100 bars — the same read the desk analyst gets — and can compose new rows. It can never place an order; execution stays with you in the app.