What To Look For
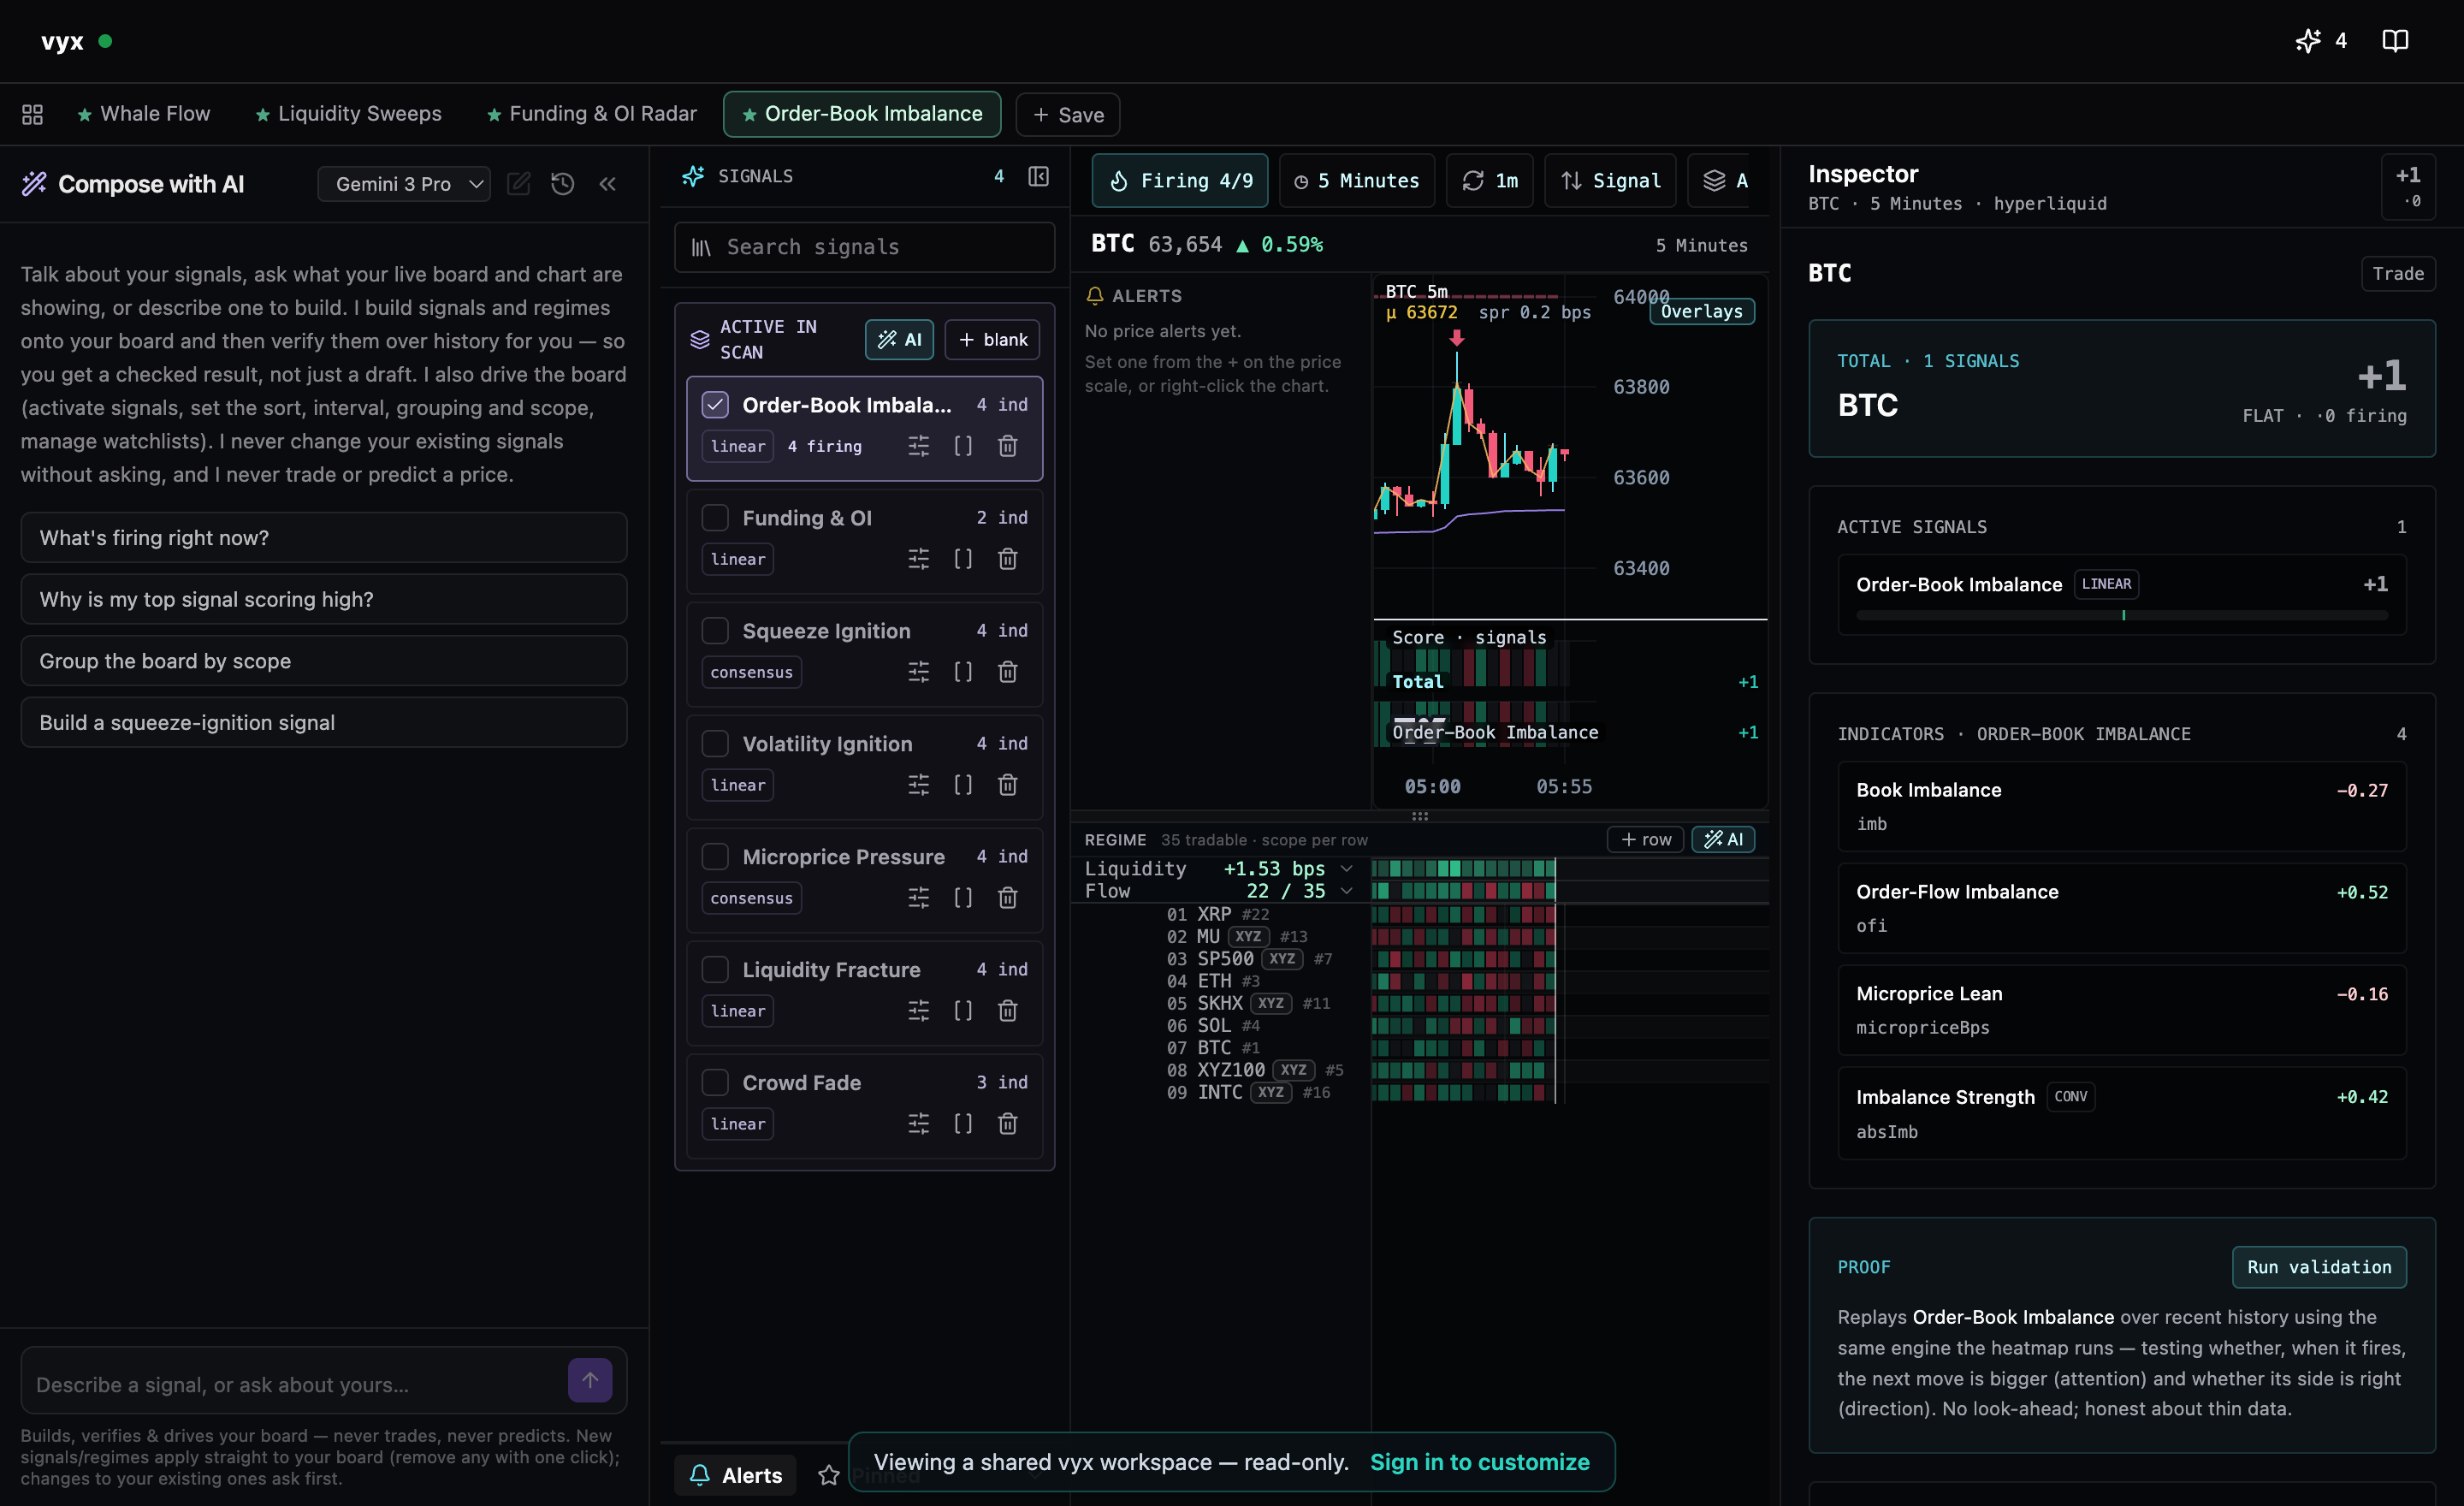
Look for persistent directional cells, abrupt reversals, and groups of markets that shift together. These patterns are usually more useful than a single intense cell.
Why Hyperliquid
Hyperliquid is the leading on-chain perpetuals DEX, with a transparent on-chain order book and a cross-asset universe spanning crypto, tokenized equities, commodities, FX, and indices. Its perps carry funding and open-interest data, which makes them useful for scanning both pressure and positioning across markets.
Read It In Three Passes
A heatmap rewards a fast, repeatable routine more than staring at one intense cell. Scan the whole surface first, then narrow, then confirm on the chart.
- Surface — which clusters of markets are leaning the same way right now?
- Persistence — has a cell held its colour across several intervals, or is it a one-print flicker?
- Confirm — drop into the pair, check spread and recent volatility, and see whether executed trade flow agrees with the resting book.
FAQ
What interval should I watch?
Use short intervals — seconds to a few minutes — for live monitoring, and a longer interval to confirm a shift is persistent rather than a single print.
Does vyx place trades?
No. vyx is a visualization and research tool.
Can the heatmap replace chart review?
No. The heatmap is designed to decide where chart review should happen next.