The intuition
The same setup behaves differently in different markets. A sweep-and-reclaim at a level runs when order flow is firing across half the venue and funding is flat; the identical pattern gets sold into when leverage is stretched everywhere and the books have thinned. The pattern did not change — the state of the market around it did. A regime is a name for that state, and the point of measuring it is to know which market you are in before you trade the setup.
Regime in order-flow terms
Strip the word of its mystique. Most tools hand you a regime as a label — risk-on, risk-off, trending, choppy — computed somewhere you cannot see. In order-flow terms a regime is simply one metric that every market already carries, reduced across many markets into one number per candle. Three choices define it completely:
- The metric — funding, open-interest change, spread, order-flow imbalance, CVD, or any formula you write.
- The reduction — the median, the mean, or the share of markets meeting a condition (breadth).
- The slice — the whole venue, an asset class, a sector or theme, a watchlist, what is on screen, or only the markets where your signals are firing.
regime(t) = reduce( metric(m, t) for m in slice ) For every candle t, evaluate the metric on each market m in the slice, then reduce the set to one number. Median funding across all markets, or the share of crypto markets where OFI is firing, are both regimes under this definition — the difference is only which metric, which reduction, and which slice.
- 1 Median funding, all markets — is leverage paying to be long or short across the venue?
- 2 Breadth of OFI firing, crypto — is order-flow pressure broad, or are three names carrying the board?
- 3 Median spread, tokenized equities — have the equity books stepped back from the touch?
- 4 Breadth of open-interest surges, memes — is new money entering the most speculative corner first?
VYX paints regimes as the regime band: a few rows pinned above the heatmap, painted on the same timeline as the board below. Click a row’s name to set what it measures, how it reduces, and which slice it reads — or describe the row in a sentence and let the AI build it. Nothing is baked in, and two rows on two different groups is how you watch one cohort against another. Over the MCP connector, vyx_regime returns each row as a series over its last 100 bars — the read the desk analyst gets.
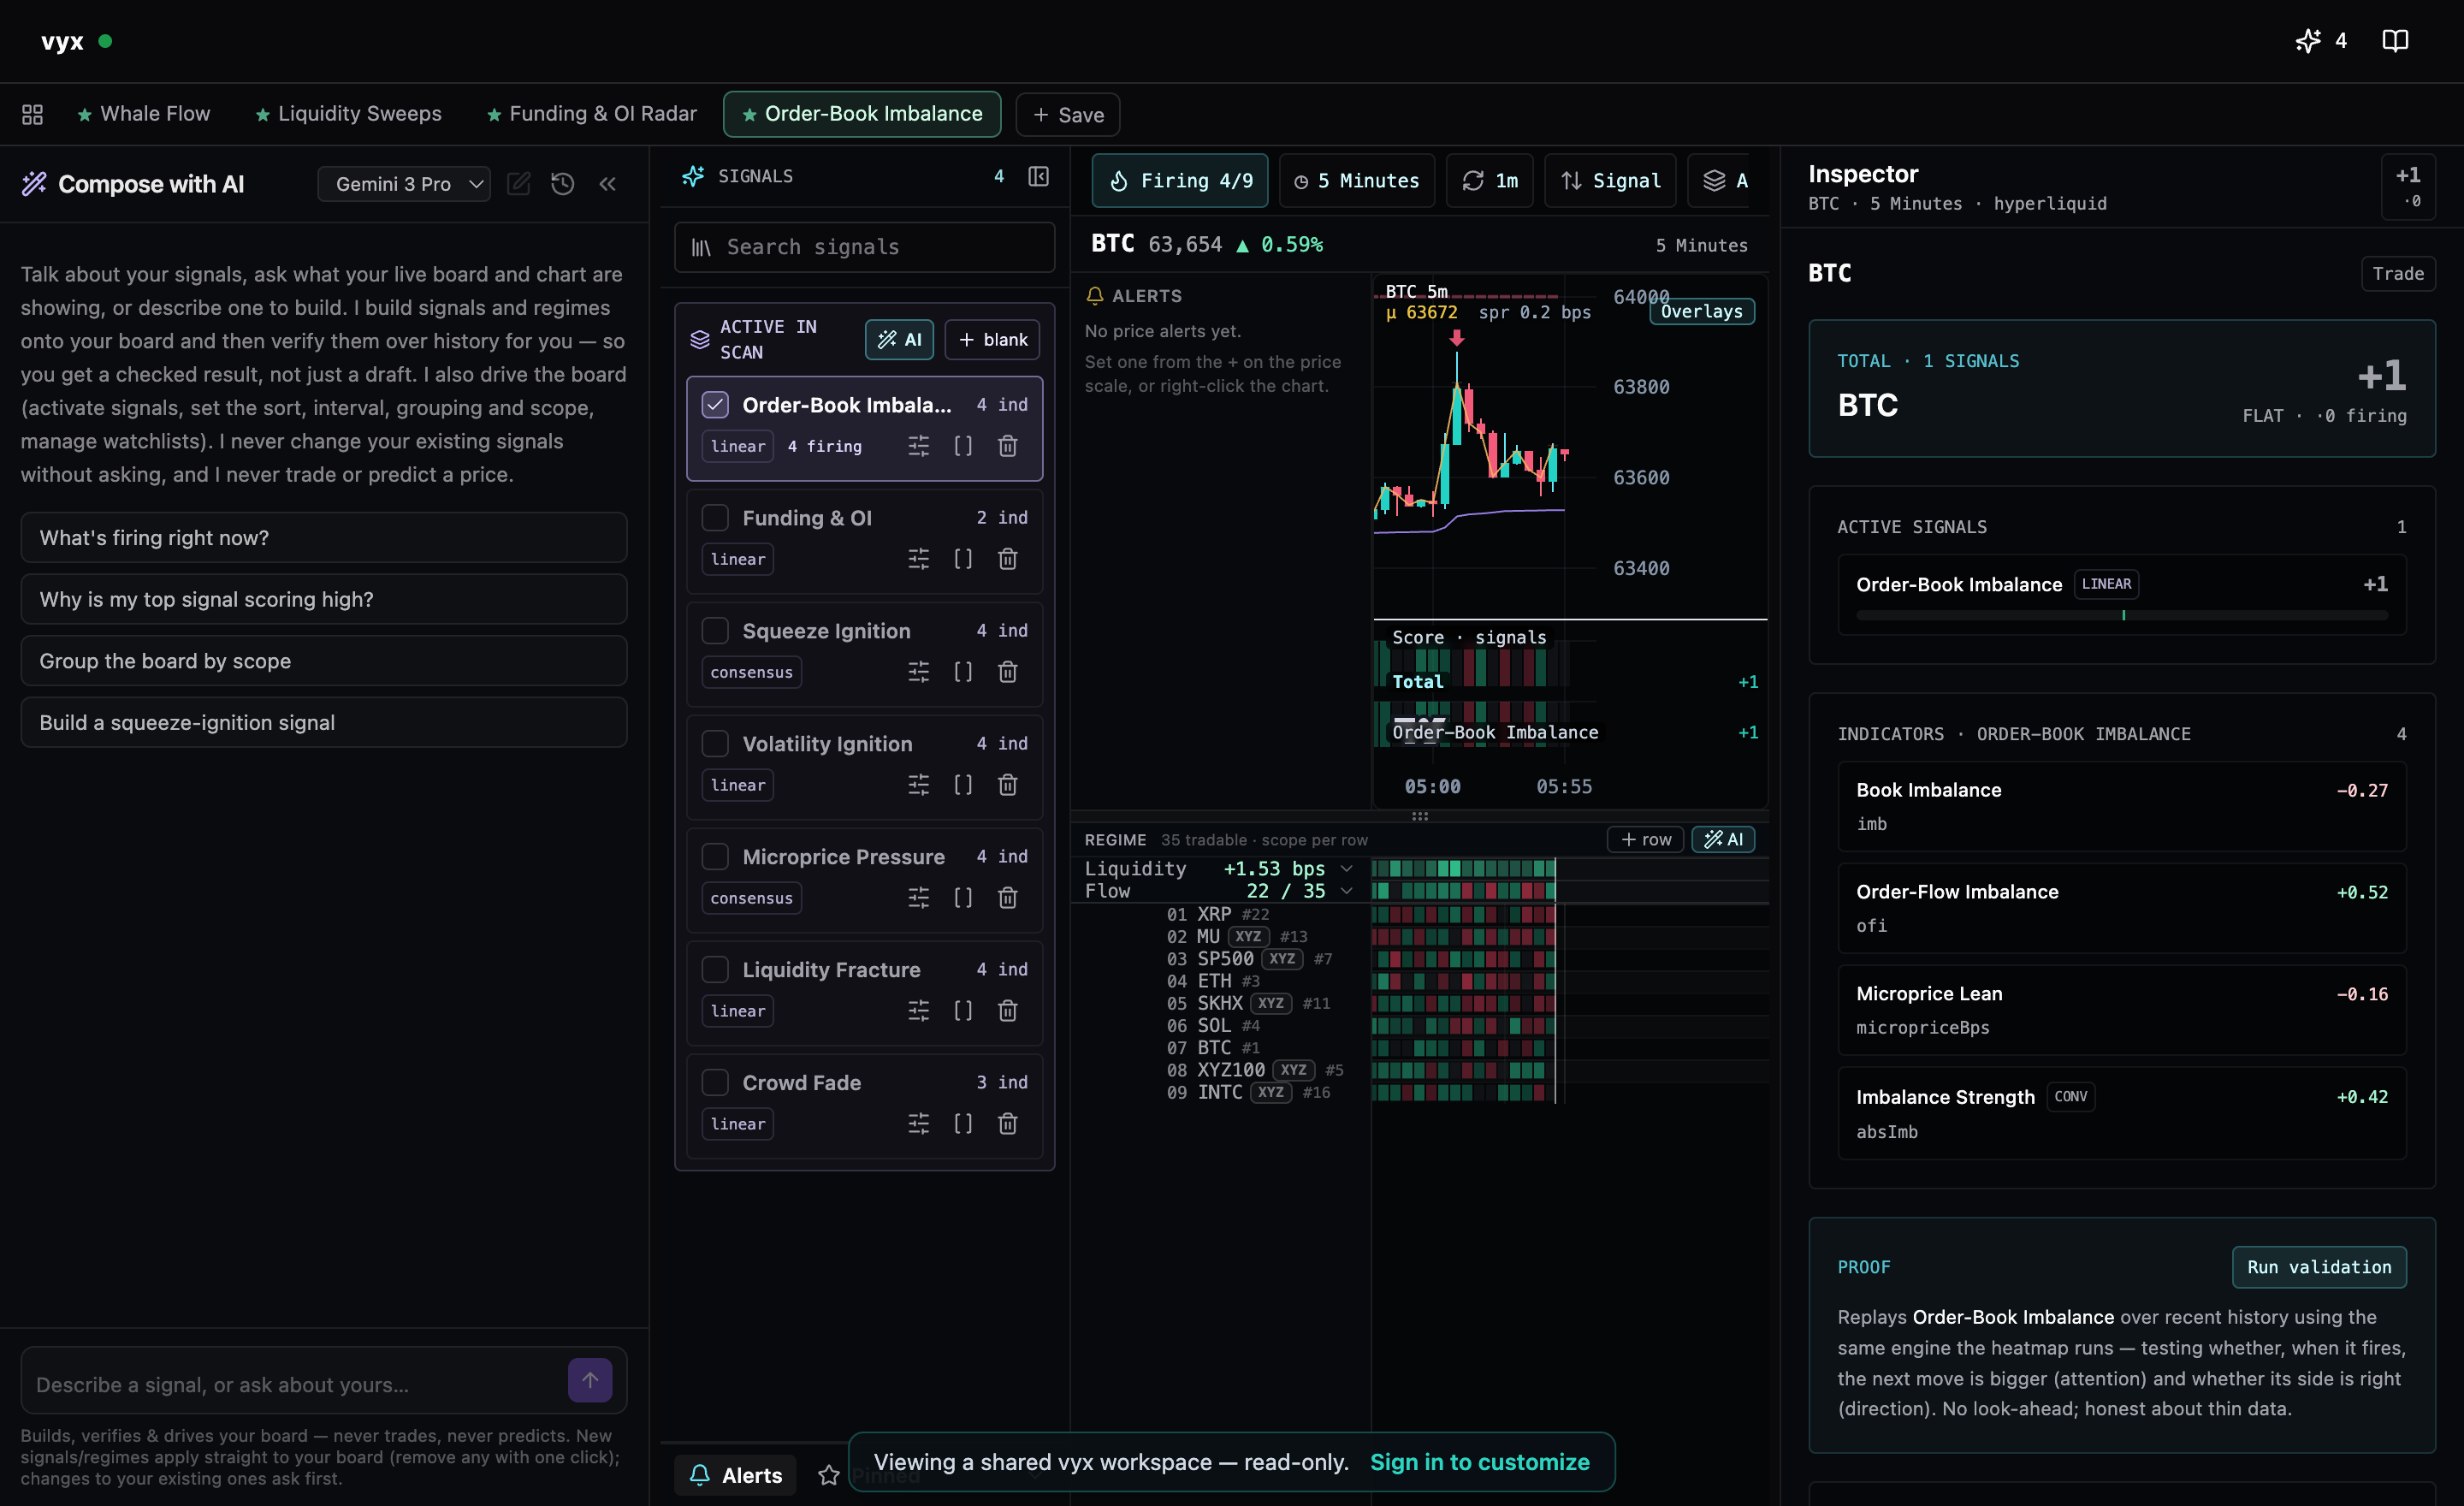
Why it belongs on the same timeline as the setup
A market overview on a separate page becomes something you glance at in the morning and forget by the third trade. A regime row painted on the board’s own time axis changes the question in front of you from “is this setup clean?” to “does the market agree with it?” — because the two are drawn on one clock. Read against its own recent range, a row tells you whether the current state is ordinary or stretched; read as a series, it tells an analyst or an AI far more than any label could.
A regime row describes the market’s current state from measured data. It is not a prediction and not a signal to buy or sell. Use it to decide whether a setup deserves your attention at all, then confirm with price and flow on the market itself.
Further reading
Related
FAQ
What is a market regime in trading?
The prevailing state of a whole market — how leverage is positioned, how deep the books are, how broad the order-flow pressure is — as opposed to the pattern on any one chart. Traders use it to judge whether a setup is being taken in a market that supports it.
How does VYX measure a market regime?
As one metric reduced across a slice of Hyperliquid’s 300+ markets into a single number per candle — for example the median funding rate across all markets, or the share of crypto markets where order-flow imbalance is firing. You choose the metric, the reduction and the slice, and the row paints above the board.
Is a regime a trading signal?
No. It is context for judging a setup — a measured description of the market’s state, never a trigger to buy or sell. VYX gives no advice.
Can I compare two parts of the market?
Yes. Scope one regime row to memes and another to L1s, or one to crypto and another to tokenized equities, and the band becomes a comparison: which cohort is leading, which is being sold into, and where the two diverge.
See it on the live map
Scan order-book pressure across 300+ Hyperliquid markets in real time.
Open VYX