The intuition
Stop-losses and resting orders pile up at the obvious places — just beyond a swing high or low, a round number, the edge of a range. That cluster is liquidity: a pool of orders waiting to be filled. A liquidity sweep is a fast push that runs price into that pool, fills against it, and frequently snaps back once the orders are taken. The move that looked like a breakout was the market reaching for liquidity, not starting a trend.
Buy-side vs sell-side liquidity
Which pool gets swept tells you which way the trap was set:
- Sell-side liquidity sits below price — the stop-losses of longs and resting sell stops. A downside sweep spikes through the low, triggers those stops, and can reverse up.
- Buy-side liquidity sits above price — the stop-losses of shorts and resting buy stops. An upside sweep runs through the high, triggers those, and can reverse down.
- The tell is the wick: price takes the liquidity and rejects, leaving a long tail at the level rather than closing through it.
sellRun >= highest(sellRun, 30) && cvdLow <= -100000 There is no single "sweep" indicator to trust blindly — a sweep is a shape in the flow. vyx exposes the pieces: buyRun/sellRun (the largest same-side taker run — the sweep itself), cvdHigh/cvdLow (how far net aggression spiked inside the candle), and tradeMaxBuy/tradeMaxSell (the largest single print). Combined, they flag a burst of one-sided aggression — the sweep’s signature — across 300+ Hyperliquid markets.
sellRun >= highest(sellRun, 30) && imb >= 20 A 30-candle-high sell run meeting a bid-heavy book (imb positive) is the classic sweep-and-absorb: aggressive sellers run the stops below, but resting demand soaks up the flow — often where a reversal starts. Flip every variable for the upside version (buyRun into an ask-heavy book). vyx evaluates it live across 300+ Hyperliquid markets.
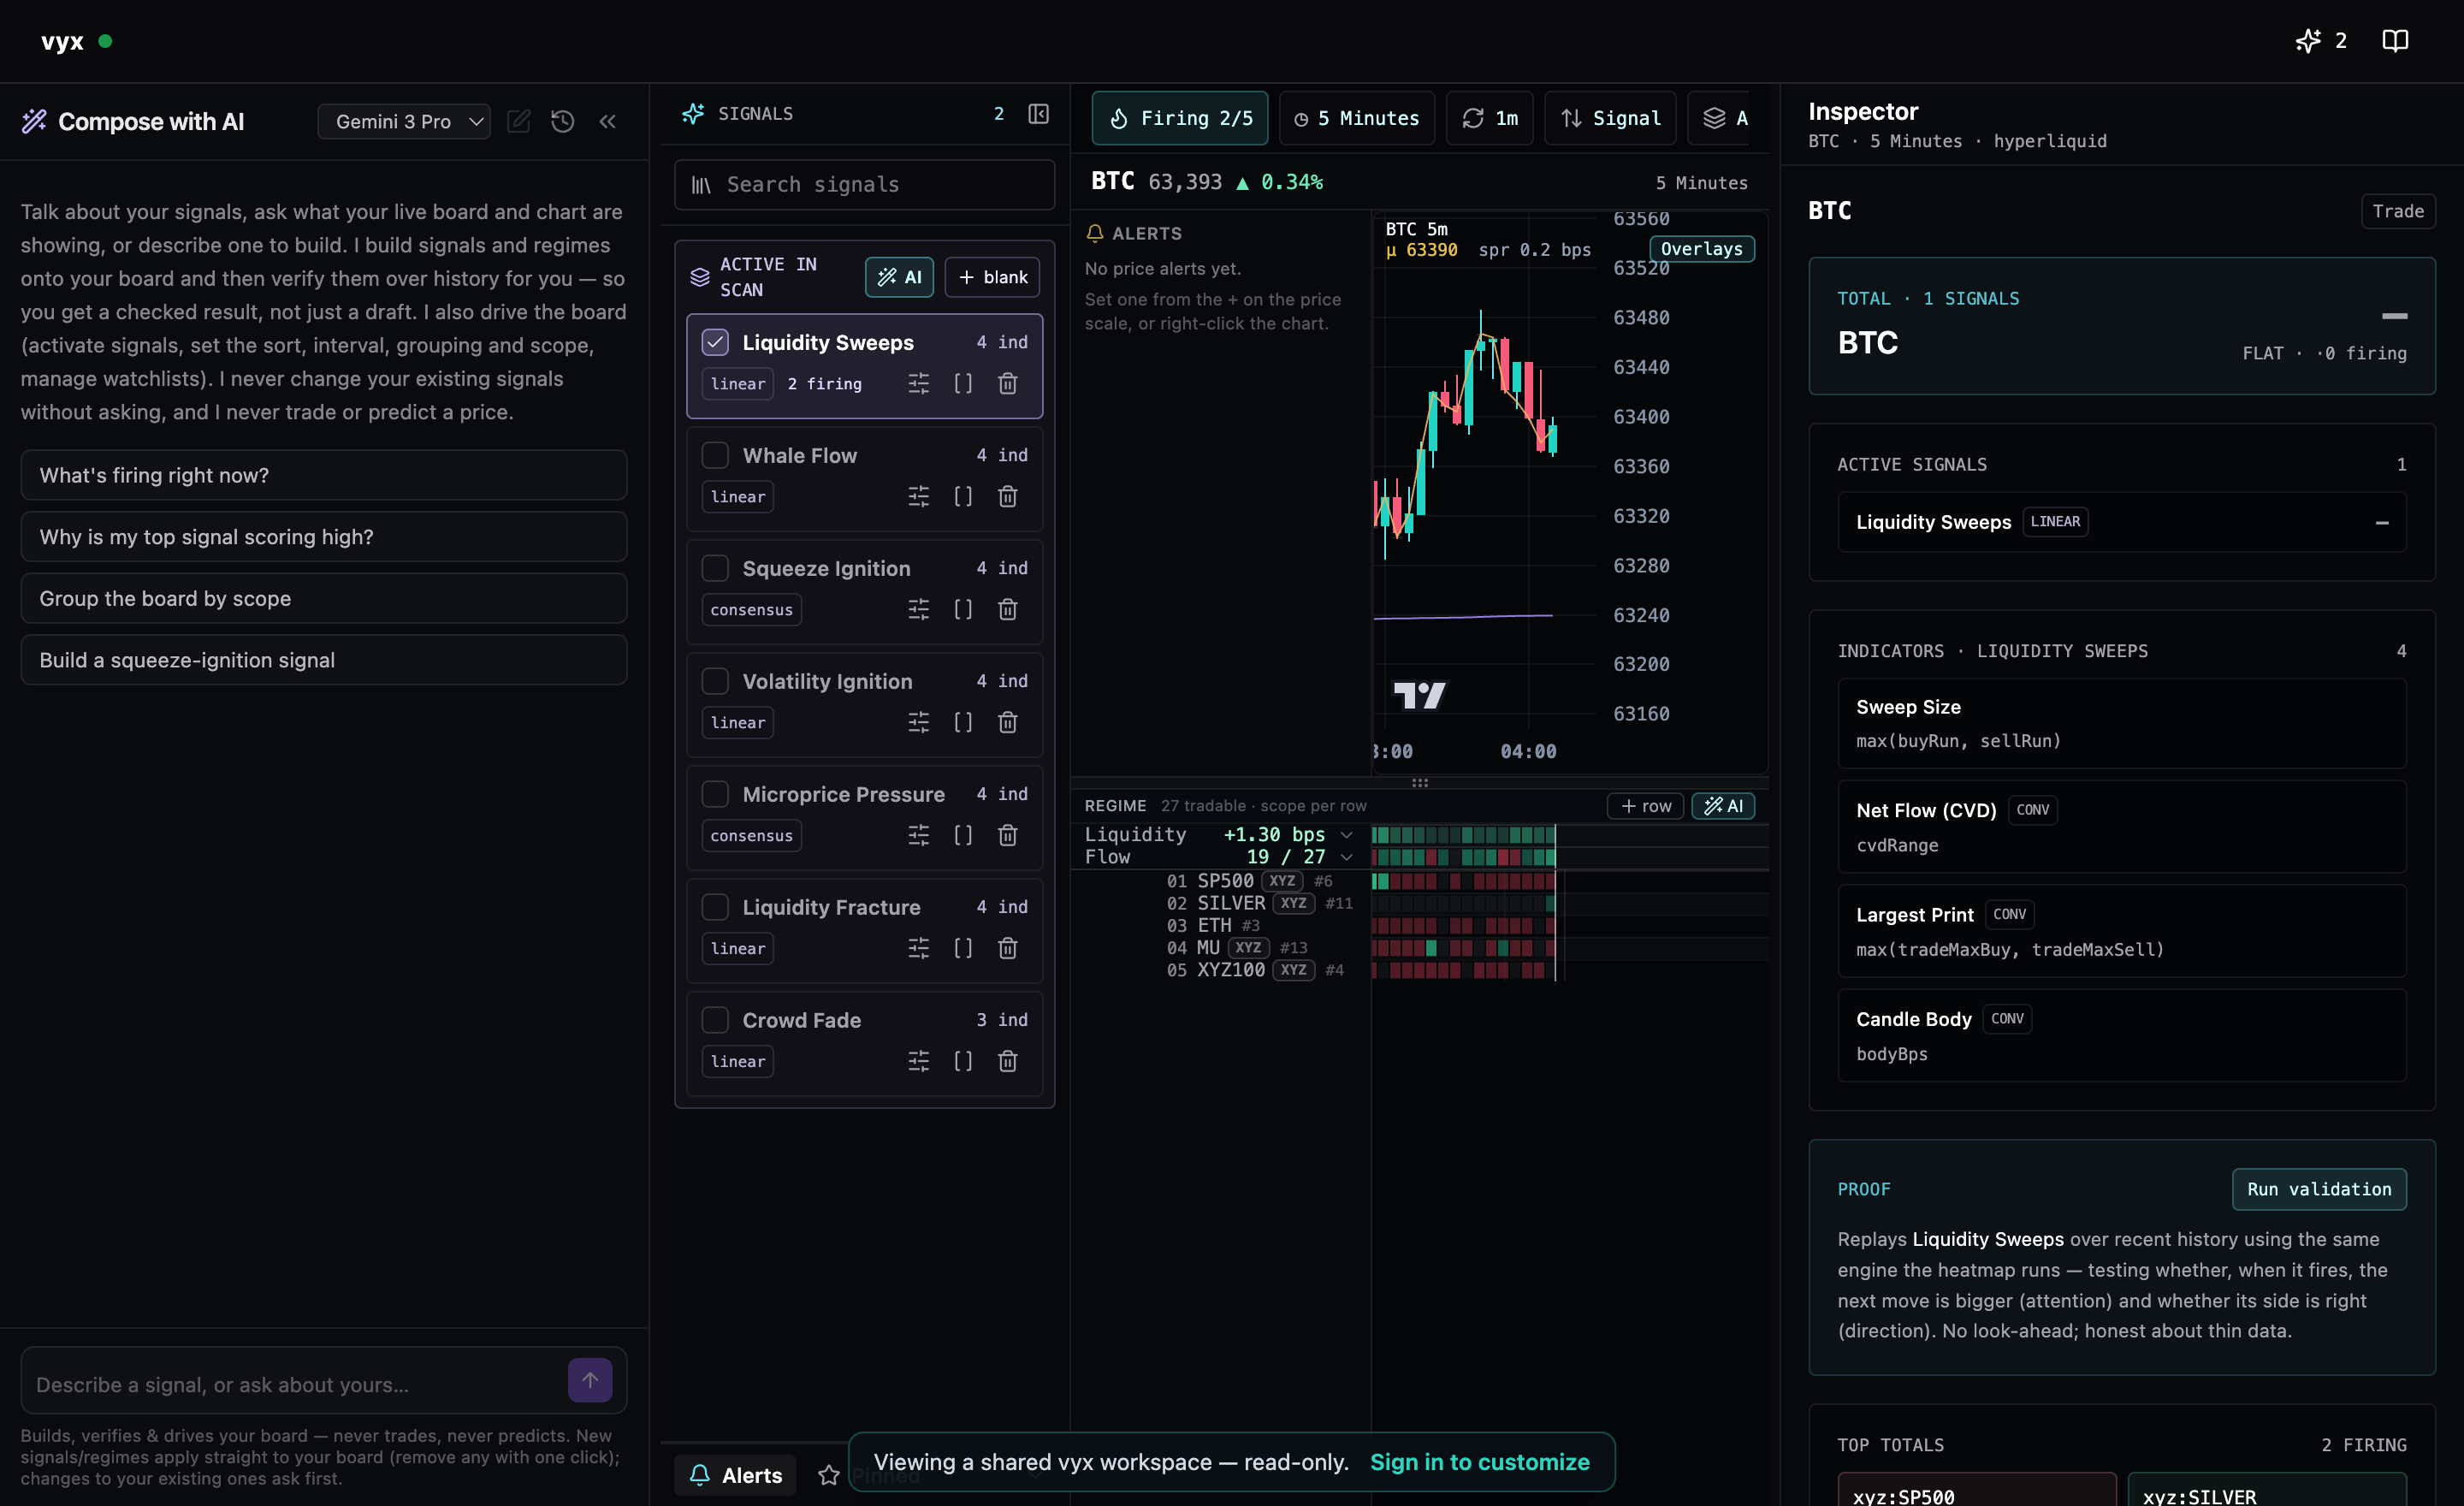
How the Aggressive Sweep signal paints across a heatmap row on the live board.
- 1 Price grinds down to an obvious swing low where long stop-losses cluster — sell-side liquidity.
- 2 A burst of aggressive selling prints:
sellRunhits a 30-candle high andcvdLowspikes down as stops cascade. - 3 The book below was thin, so price wicks through and snaps back — the "break" of support was liquidity being taken, not a trend. You wait for the reversal to confirm; you never trade the wick blind.
Liquidity sweeps are obvious in hindsight and treacherous live. Plenty of spikes through a level are genuine breakouts that keep going, and "stop hunt" is an interpretation, not a measurement. vyx shows you the footprint — the aggressive run, the CVD spike, the book imbalance — so you can judge whether liquidity was taken. It does not tell you a reversal is coming. Use it as confluence with the level and the reaction, never as a standalone trigger.
Further reading
- Larry Harris — Trading and Exchanges: Market Microstructure for Practitioners
- CVD — the aggressive flow that does the sweeping
- Order-Book Imbalance — the resting liquidity that gets swept
Related
FAQ
What is a liquidity sweep?
A liquidity sweep is when price runs through a cluster of resting orders and stop-losses — usually just beyond an obvious high or low — consuming that liquidity in a burst of aggressive flow, then often reversing. It is also called a liquidity grab or stop hunt.
What is the difference between a liquidity sweep and a breakout?
Both push price through a level. In a sweep the aggression dries up or reverses once the resting liquidity is taken, so price snaps back; in a real breakout the flow keeps going. The tell is what order flow does after the level breaks, not the break itself.
Is a liquidity sweep the same as a stop hunt or liquidity grab?
Yes — they are different names for the same event: price reaching into a pool of stop-losses and resting orders to fill against it. "Stop hunt" implies deliberate intent, while the part you can actually measure is the liquidity being consumed.
How do you spot a liquidity sweep?
Look for a burst of one-sided aggressive flow — a large taker run and a CVD spike — pushing through an obvious high or low and then stalling, leaving a wick. vyx surfaces that footprint live across 300+ markets, but confirm with the level and the reaction before acting.
See it on the live map
Scan order-book pressure across 300+ Hyperliquid markets in real time.
Open vyx