Not Just A Price Heatmap
Most "crypto heatmaps" colour each tile by 24-hour price change — a lagging summary you could read off any ticker. vyx colours by *whatever you choose*: order-book imbalance, executed flow (CVD), sweeps, funding, open interest, volatility — a single variable, or a formula that combines them. That’s the difference between seeing what already happened and seeing the pressure building now.
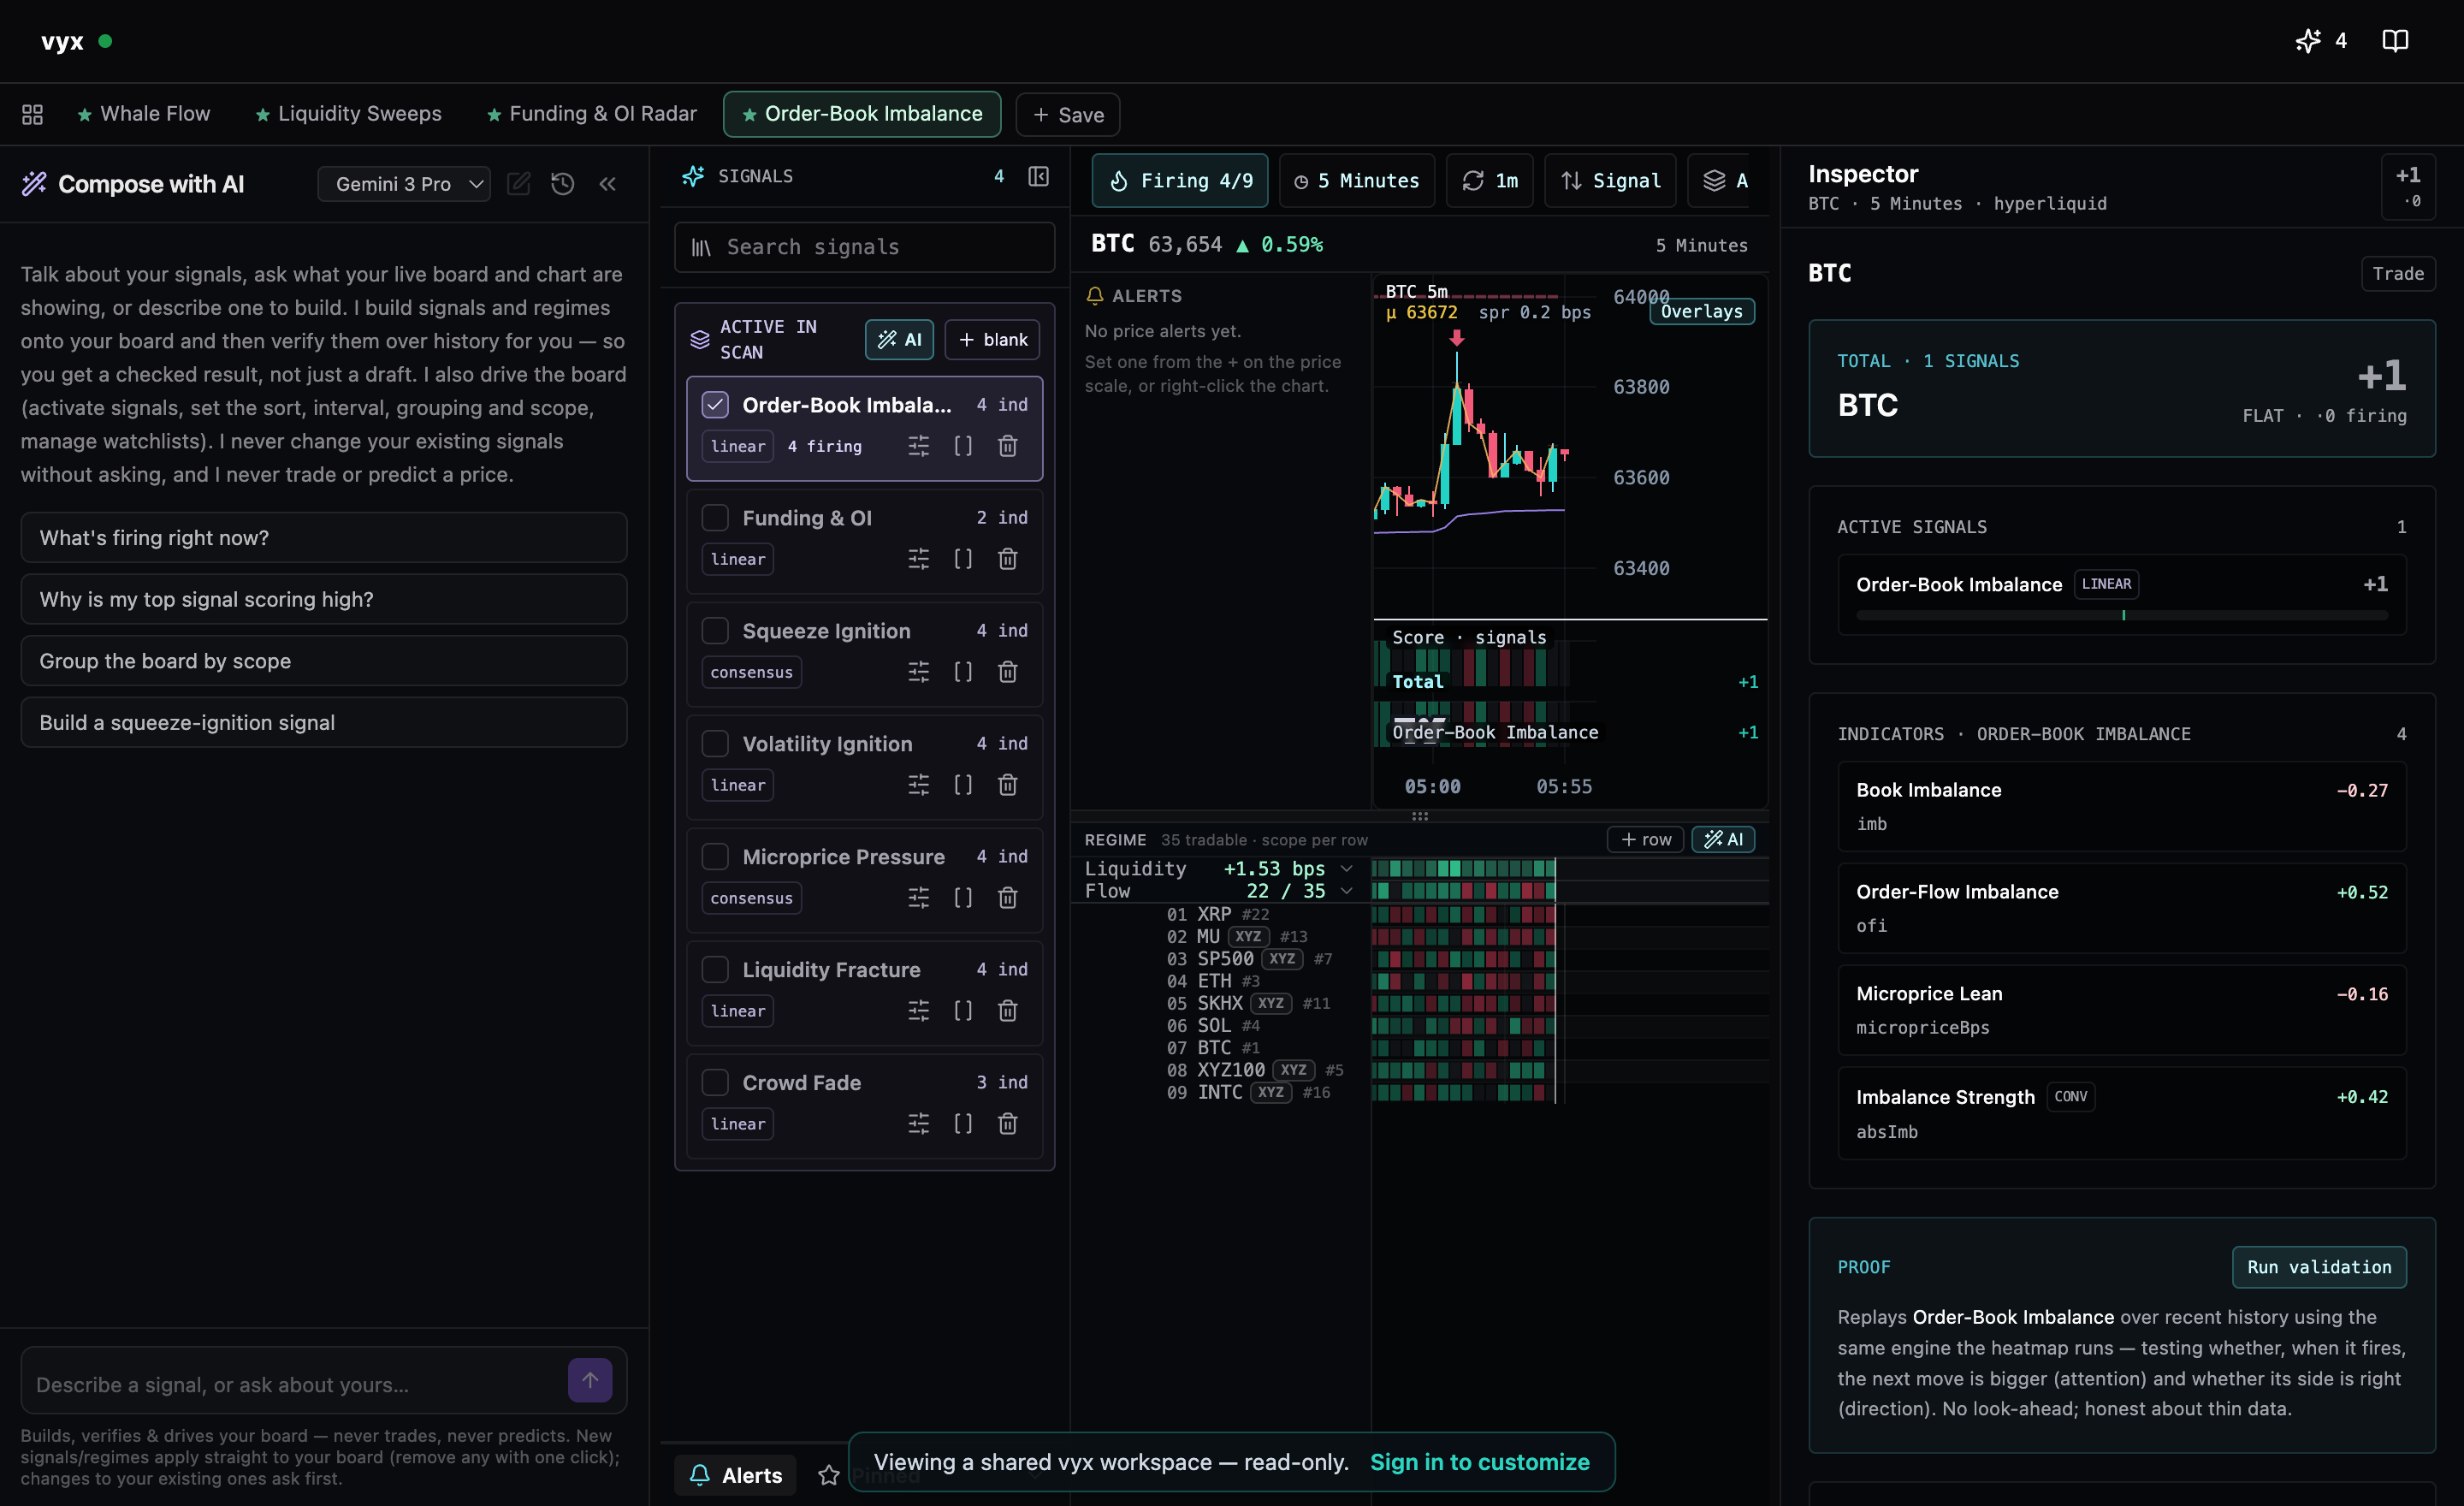
Read The Whole Market At Once
A chart shows one market; a heatmap shows the field. vyx compresses 300+ markets into a single surface so you compare strength, persistence, and clustering instead of flipping through charts. Sort and group the grid, then expand any cell into its full signal breakdown and chart.
Colour It By Anything
The heatmap isn’t tied to any fixed metric — it colours by anything you can express. Pick a built-in signal, or write a formula over the full variable set (order flow, derivatives, price, volume, and the math to combine them), and every cell recolours live around it. The heatmap becomes a scan for exactly the behaviour you care about — even one nobody else measures.
FAQ
What is a crypto heatmap?
A grid that shows many crypto markets at once, each tile coloured by a metric so you can compare the whole market at a glance. Most colour by 24h price change; vyx colours by live microstructure — order-book imbalance, CVD, funding, and more.
What can the vyx heatmap colour by?
Anything you can express as a formula — a single variable (order-book imbalance, CVD, funding, open interest, volatility, spread, price, volume…) or a multi-factor signal you compose. It is not limited to a preset menu, and every cell recolours live as the data updates.
Is the vyx heatmap real-time?
Yes. It streams live from the Hyperliquid feed across 300+ markets and recolours as order flow and the book change — not a daily or hourly snapshot.
How is it different from a market-cap heatmap?
A market-cap heatmap (e.g. Coin360-style) sizes and colours tiles by price change. vyx is a microstructure heatmap: it colours by the order-book and trade-flow signals that move price, so you see pressure forming rather than the result after the fact.